
Historical Tracking Data
Custom reports and AIS data spanning a decade
With AIS data retention of 10 years, MXAK provides vessel movement analysis, accident investigations, risk assessments, and environmental impact insights. We offer raw data, custom reports, and visualizations tailored to your needs.
Submit a Data Request Form to connect with our Maritime Operations Analyst for expert assistance.
Become a Member to access exclusive discounts on data reports and services.
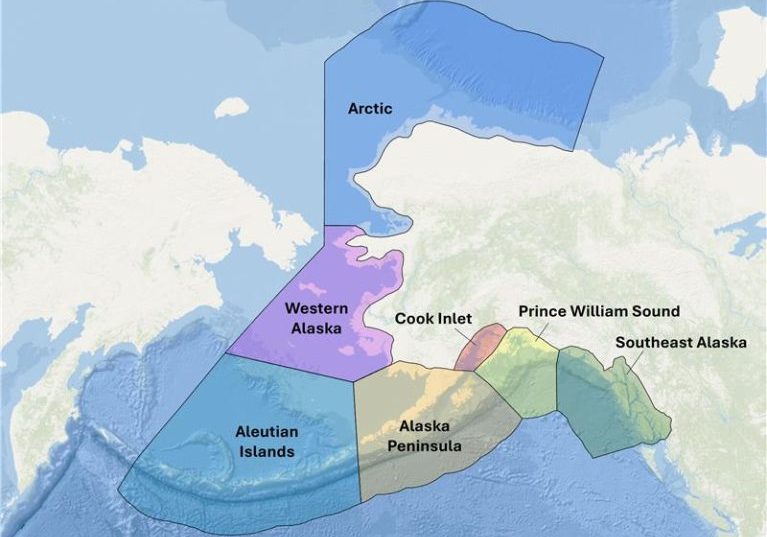
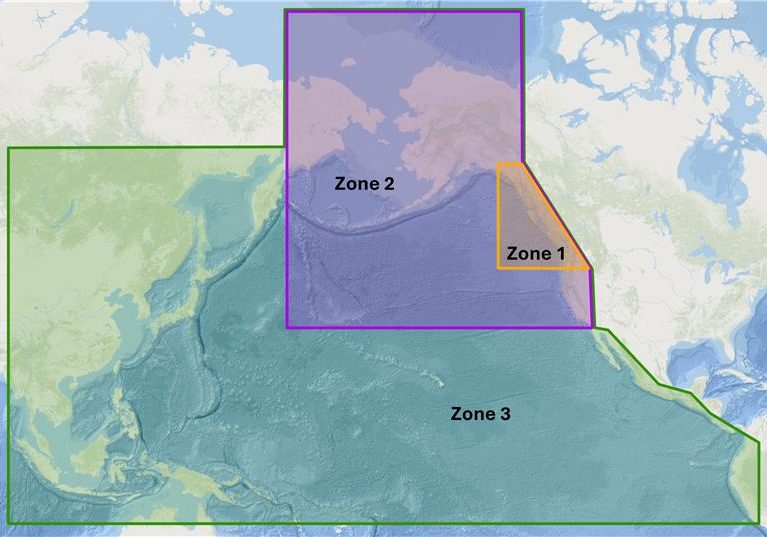
Ais Reporting Regions
Terrestrial & Satellite
Satellite Zones
Region Based Reports
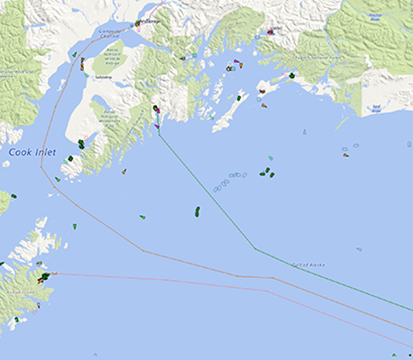
Multiple Tracklines
This report provides position reports for multiple or all vessels within a specified time or geographic area. Position reports are delivered in CSV format with accompanying graphic or shapefile.
Read More
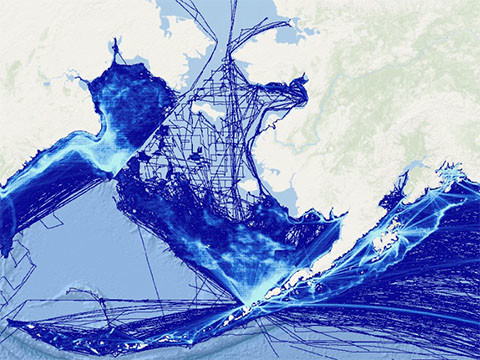
Vessel Density
This report provides a graphic display and shapefile of the density of vessels within a specified geographic area in a chosen year.
Read More
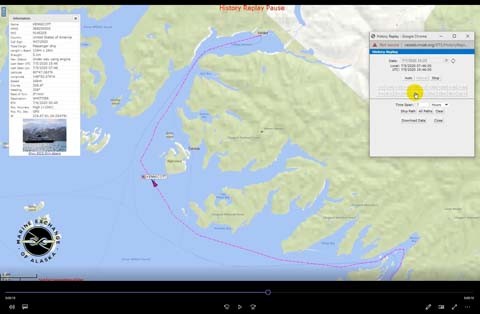
Video Replay
This report displays dynamic interactions of multiple vessels, or the details of a single vessel's behavior. Replays are delivered as a Windows Media Player (WMV) file and will also include the raw data in CSV format.
Read More
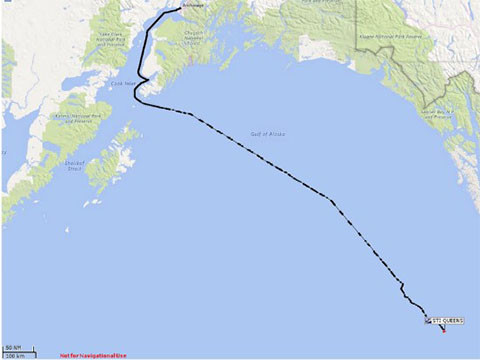
Single Trackline
This report provides position reports for a single vessel within a specified time or geographic area. Position reports are delivered in CSV format with accompanying graphic or shapefile.
Read More
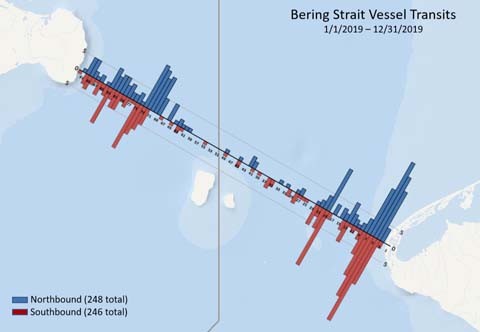
Passageline
This report provides a graphic display and CSV file of the total number of vessels that cross over a specified line in a chosen year.
Read More
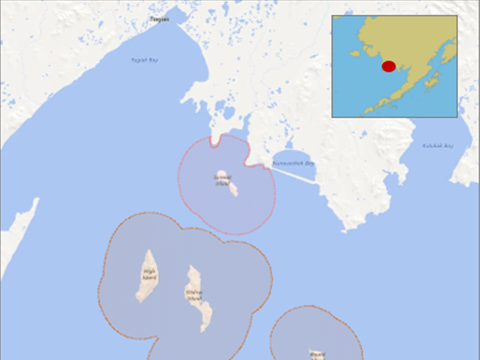
Geofencing
Geofencing provides monitoring of specified areas and/or vessels.
Read More
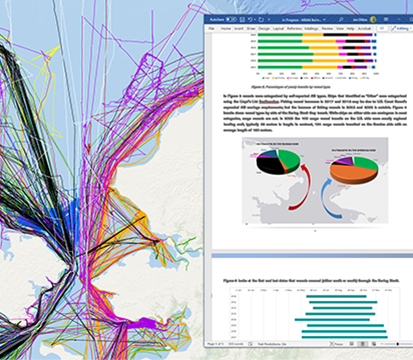
Data Analysis
Custom analysis for those needing more than just raw data.
Read More
Subsea Cable Monitoring
Using AIS technology and geofencing to provide visibility and alerting when vessel activity nears subsea cable assets.
Read More
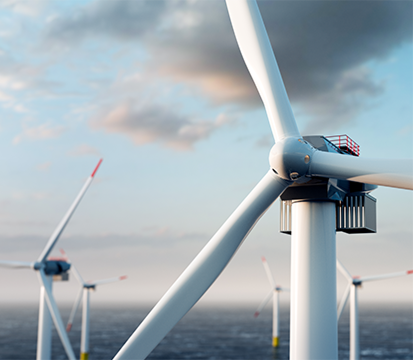
Offshore Structure Safety
Using Significant Peripheral Structures (SPS) equipped with AIS ATONs will display offshore structures on a vessel's electronic charting system.
Read More
Data Request Form
Reports Available but not Displayed:
Parameters needed: Time Span, Zone and FilterZone Summary-Count of Types of Vessels in Zone
Extended Zone Summary-List of all vessels in Zone
Arrival/Departure-List of all vessels Enter and/or Exit Zone
Speed Summary-List of Vessels by Min/Max/Average Speed
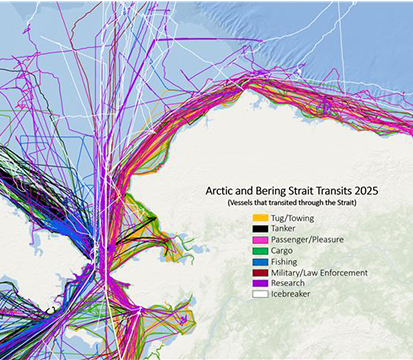
Crossing-List of Vessels that have crossed a Zone (Transits)
Berth Time Summary-List of Vessels how long they were at Anchor
Weather Report-List of Winds, Wind Dir., Gusts, Gusts Dir., Air Temp., Air Press.